Statistical Process Control (SPC): Core Quality Tool
Table of Contents
ToggleWhat is Statistical Process Control (SPC)?
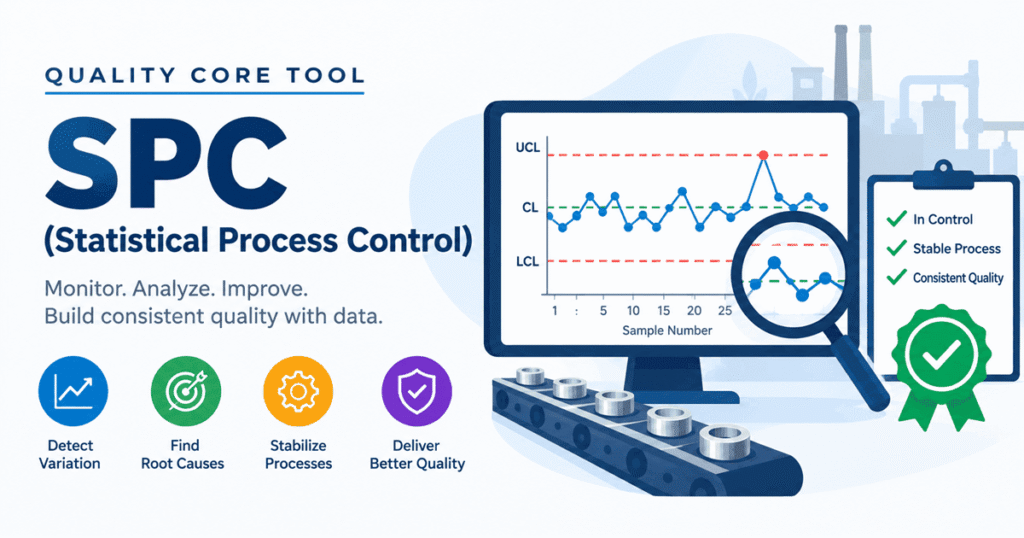
Statistical Process Control (SPC) is a technique to detect and prevent poor quality by continuously monitoring a manufacturing process. Therefore, this method help us to maintain and improve quality in any manufacturing process.
The whole process is done by collecting data of different machines and instruments. Then these data is analyzed to understand how the process is running and to identify if any changes are required.
By regularly monitoring the process, Statistical Process Control (SPC) helps detect variations at an early stage and allows corrective actions to be taken before they affect product quality.
Control Charts
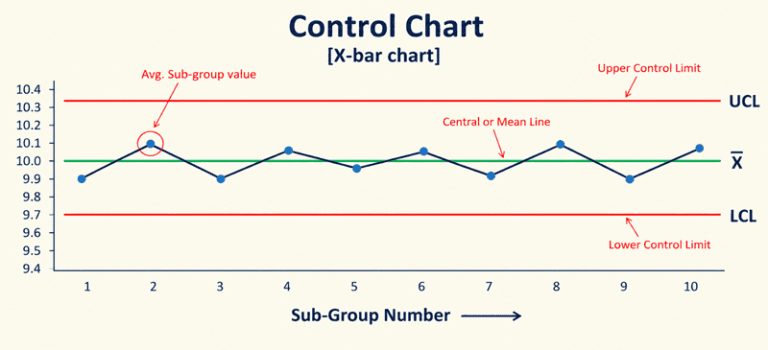
It can be said that process is in control, if:
- No sample point outside the limits
- Most of the points should be near process average
- Almost equal number of points should above or below the centre line.
Types of Control Charts
- Attributes Type
- Variables Type
1. Attributes-type
- p-charts
- c-chart
2. Variables-type Control Charts
- R-chart (range)
- X-Bar chart (mean)
Types of Variations
- Extreme Variations,
- Shifts,
- Trends,
- Erractic Fluctuations
1. Extreme Variations
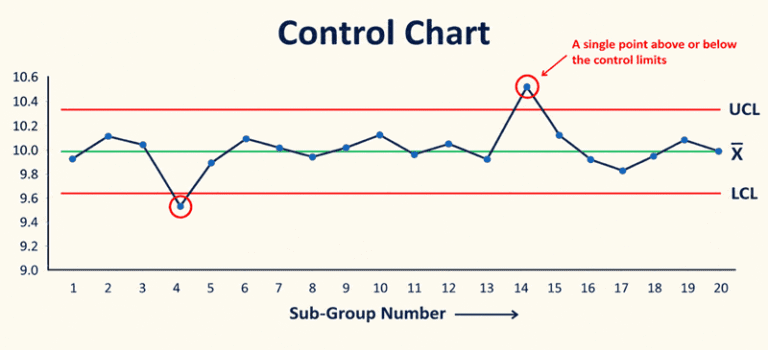
Extreme variation is recognized by the points falling outside the Upper and Lower control limits.
Causes of Extreme Variations:
Error in measurements
Wrong setting of the machine, tools, etc.
Samples were chosen at the start or the end of an operation.
2. Shifts
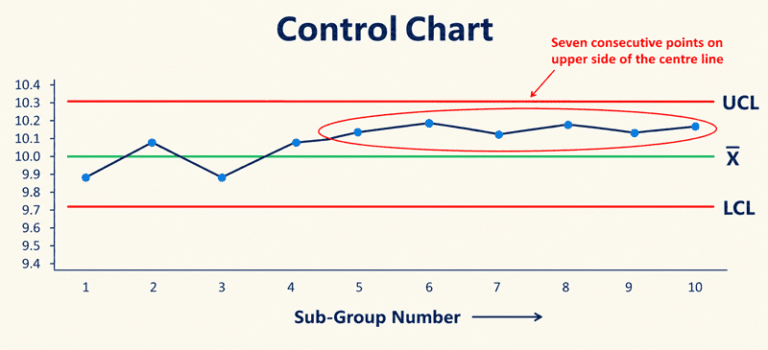
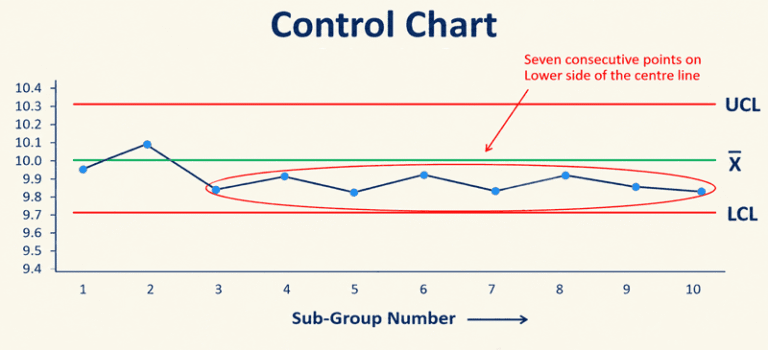
When a series of consecutive points fall above or below the center line on the control chart then it is assumed that a ‘Shift‘ in the process has taken place. It is generally assumed that when 7 consecutive points lie above or below the center line, the shift has occurred.
Causes of Shift:
Change in Machine setting.
Change in Material.
Loose fixture etc.
Change in Operator, Inspector, and Inspection equipment.
Unskilled or New operator or carelessness of the operator.
3. Indication of Trend
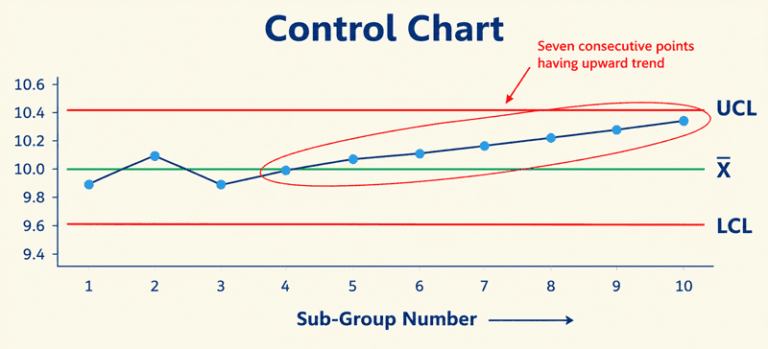
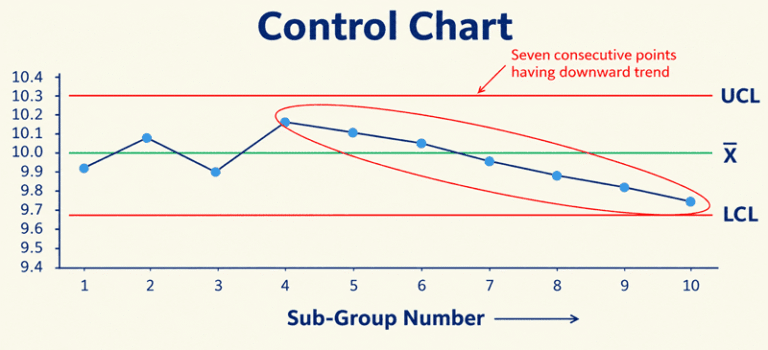
If the consecutive points on the control chart tend to move steadily either towards Upper Control Limits (UCL) or Lower Control Limit (LCL), then it can be assumed that the process is indicating a ‘Trend’ i.e. change is taking place slowly.
Causes of Trend:
Tool wear
Wear of thread on the clamping device
Clogging of fixtures and holes
Effect of temperature and humidity.
4. Erratic Fluctuations
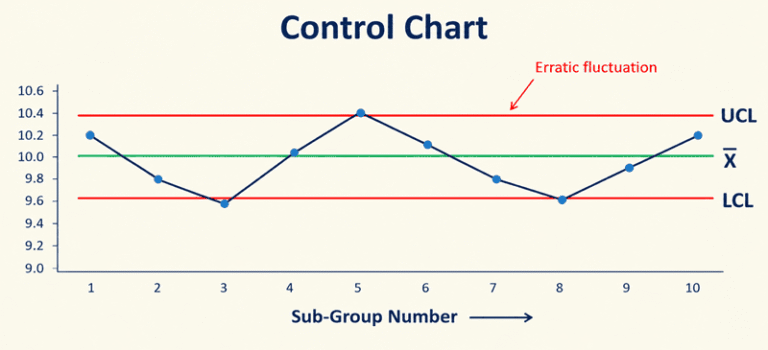
Erratic fluctuation is characterized by ups and downs. This may be due to a single cause or a group of causes affecting the process. The cause of erratic fluctuations is rather difficult to identify. It may be due to various causes acting at different times in the manufacturing process.
Causes of Erratic Fluctuations:
Frequent adjustment of the machine.
Change in Man, machine, method, and material, etc.
Processing of different types of material.
Process Capability Indices: (Cp) and (Cpk)
Process capability – Cp: It is defined as the tolerance width divided by the total spread of the process.
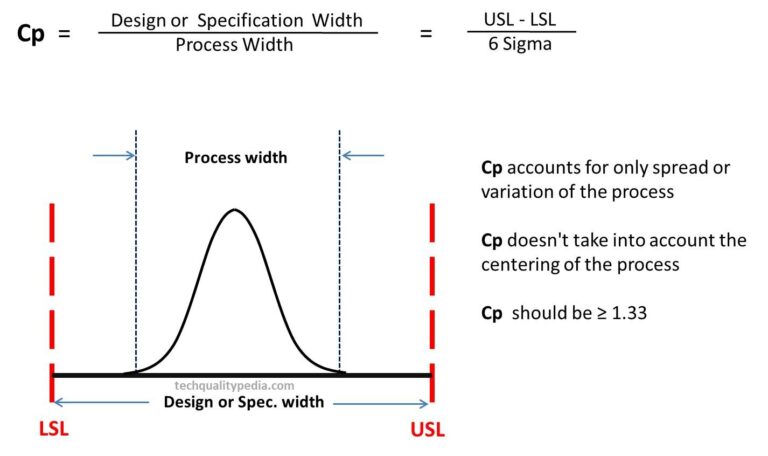
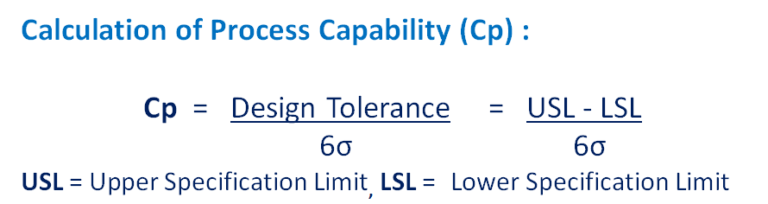
Design Tolerance or Tolerance Range both are same thing.
Process Capability Index – Cpk: This capability index accounts for the centering of the process and is defined as the minimum of Cpk upper and Cpk lower.
Cpk indicates the shifting of the process from the target value or mean value.
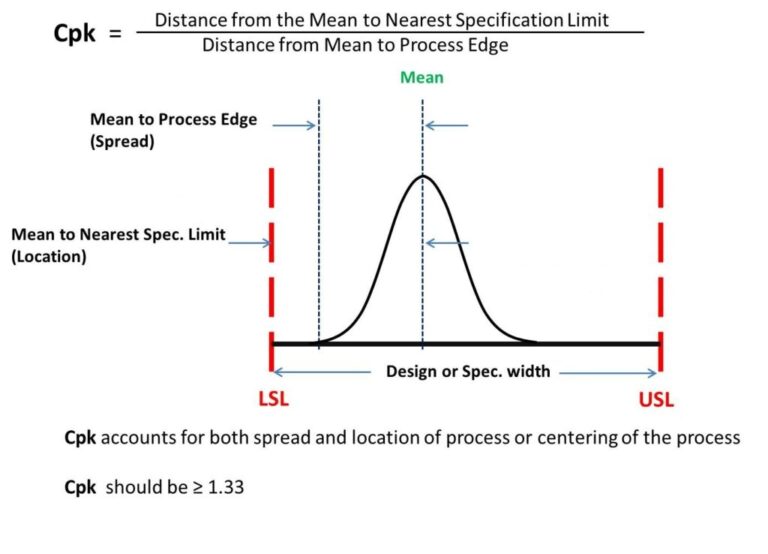
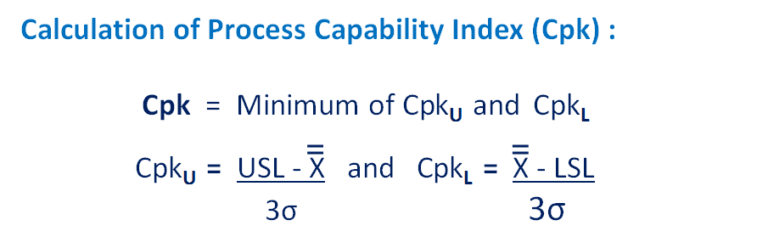
In Process Capability Index (Cpk) only minimum value will be consider in between CpkU and CpkL
Difference between Cp and Cpk
| Cp | Cpk |
|---|---|
| Cp – Process Capability Cp is the Process Capability. It is defined as the tolerance width divided by the process width (6σ). | Cpk – Process Capability Index Cpk measures how close the process is to the center of the design specification limits. |
| Does not take into account the centering of the process. Considers only the spread or variation of the process. | Takes into account both process spread and process centering. Considers both the spread/variation and the centering of the process. |
Formula: Cp = (USL − LSL) / 6σ Where: | Formula: Cpk = Min (Cpu, Cpl) Cpu = (USL − X̄) / 3σ Where: |
| Cp should not be considered in isolation. It is the only used to find out whether the process is capable or not i.e. Cp ≥1.33 | Cpk should always be looked into, it is used to find out whether the process is capable to meet the customer requirements or not i.e. Cpk ≥1.33 |
Cpk value defines if the process is capable:
- Cpk= 1.33 atleast
- Cpk= 1.33 or more: 4 Sigma
- Cpk= 1.67 or more: 5 Sigma
- Cpk= 2 for 6 Sigma
Note: Cpk can never be greater than Cp.
Interpretations of Cp & Cpk
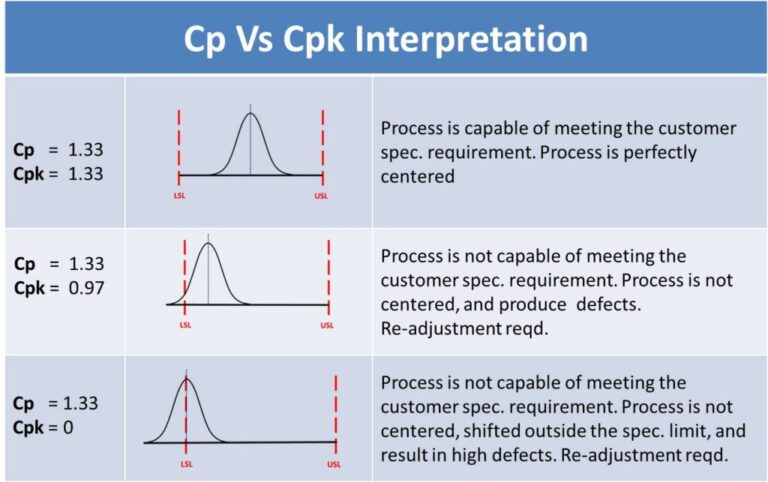
When the Cp value >1: The process spread is less and all products fall within the specification limit. Here the process is said to be quite capable of meeting the specification limit.
When the Cp value =1:The process spread is a little wide but running within the designed specification limit. Here the process is said to be just capable of meeting the specification limit.
When the Cp value <1: The process spread is large and most of the products fall outside the specification limit. Here the process is said to be incapable.
When the Cp=Cpk: The Process means is said to be at centre.
When the Cpk value <1:Indicates that the mean of the process is shifted from the target and defects will be produced.
When the Cpk value >1: The center or mean of the process may be shifted from the target but still the process is capable of meeting design specifications.
To achieve Six Sigma quality in the organization, we must reduce the variation in the process to achieve the desired value of Cp.
Cp Value | Normal Production Run | New Product Development Stage
Cp value should be ≥ 1.33 during the normal production process.
The recommended value of Process Performance Capability-Pp is ≥ 1.67 during the new product development (NPD) stage.
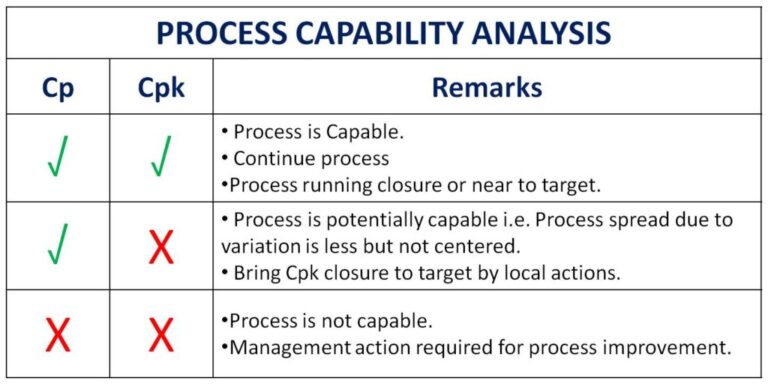
Cp and Cpk Process Capability Analysis
Frequently Asked Questions (FAQs)
What is the significance of Cp in process capability?
Cp measures a process’s potential to meet specification limits if it is perfectly centered. It indicates how capable a process can be under ideal conditions.
How does Cpk differ from Cp in practical application?
Cpk accounts for shifts in the process mean and provides a realistic view of process performance, considering actual variability and centering.
Why might Cp and Cpk values differ for the same process?
Cp and Cpk can differ if the process mean is not centered or if variations are affecting the process. Cp assumes ideal conditions, while Cpk represents real-world performance.
How can I improve both Cp and Cpk values?
To improve Cp, ensure the process is centered and reduce variability. To improve Cpk, address both centering issues and overall process variability.
How often should Cp and Cpk be measured?
Cp and Cpk should be measured regularly, especially after changes in the process or equipment, to monitor performance and ensure ongoing quality control.
How does Pp differ from Cp in practical application?
Pp reflects actual process performance, including all sources of variability and shifts, providing a more realistic assessment than Cp.
Good work man