Fishbone Diagram | Ishikawa Diagram – 7 QC Tools
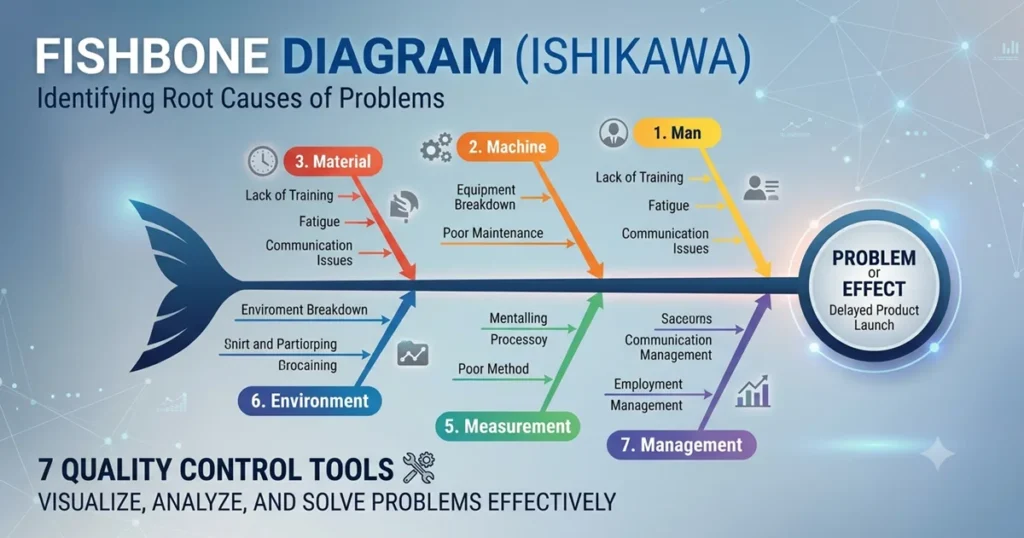
A “Fishbone Diagram” also known as “Ishikawa diagram” or “Cause and Effect diagram“. It looks like a fish skeleton, with the problem at the head and its possible causes shown as bones.
It is one of the 7 QC Tools which is used in Problem Solving Techniques like 8D, PDCA, and Six Sigma. It helps to identify all potential or possible cause of any problem.
The brainstorming technique is used in fishbone diagram. In brainstorming session, all 4M or 6M factors are taken into consideration to identify the potential causes.
These 6M – Man, Machine, Material, Method, Measurement, Mother nature (Environment)
Table of Contents
ToggleAbout Fishbone Diagram
- Developed by Ishikawa, so also known as Ishikawa Diagram
- Brainstorming techniques used to identify potential causes.
- Analysis of 4M or 6M factors are done in brainstorming session.
- It helps to identify the root cause of the problem.
To prevent the same problem from happening again.
When to use an Ishikawa Diagram
- To resolve existing quality problem.
- To prepare corrective and preventive action (CAPA) against internal or external complaints.
- Use along with Quality Tools like 5 Why Analysis, 8D, Pareto Analysis, Check Sheets etc.
The Main 6M Categories
Man (People)
Human errors, lack of training, or carelessness.
Machine
Machine breakdown or incorrect settings.
Material
Incorrect measuring tools or readings.
Method
Poor-quality raw material or defective parts.
Measurement
Wrong process or not following work instructions.
Mother nature (Environment)
Dust, temperature, humidity, or poor lighting.
How to make cause and effects diagram?
Step – 1: Describe the problem and its effects by using 5W2H approach
Step – 2: Write the problem at the head of the fish
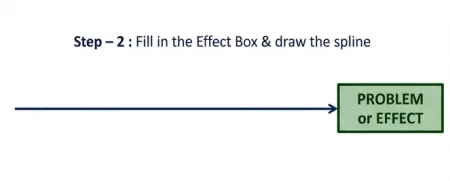
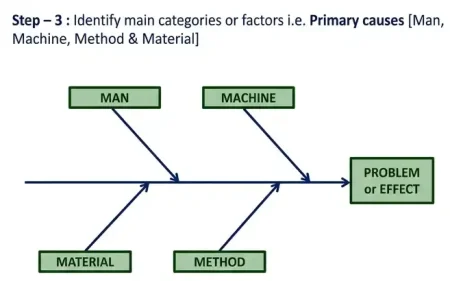
Step – 3: Draw the major cause 4M or 6M categories and connect them to the backbone of fishbone diagram.
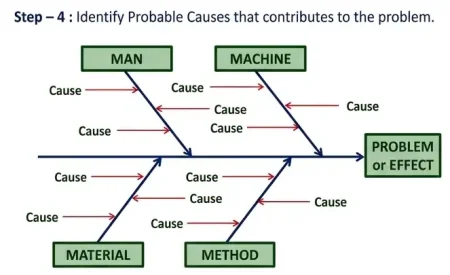
Step – 4: Discuss and list possible causes under each category.
Step – 5: Check the causes to identify the actual root cause.
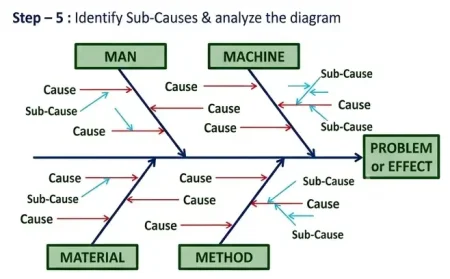
Step – 6: Take corrective action.
Benefits of Ishikawa Diagram
- We can break problems into small pieces to find the root cause.
- We can focus on the causes.
- Increase people involement and teamwork as CFT (Cross Functional Team) works
- Improve team performance and effectiveness.
- Improve process knowledge