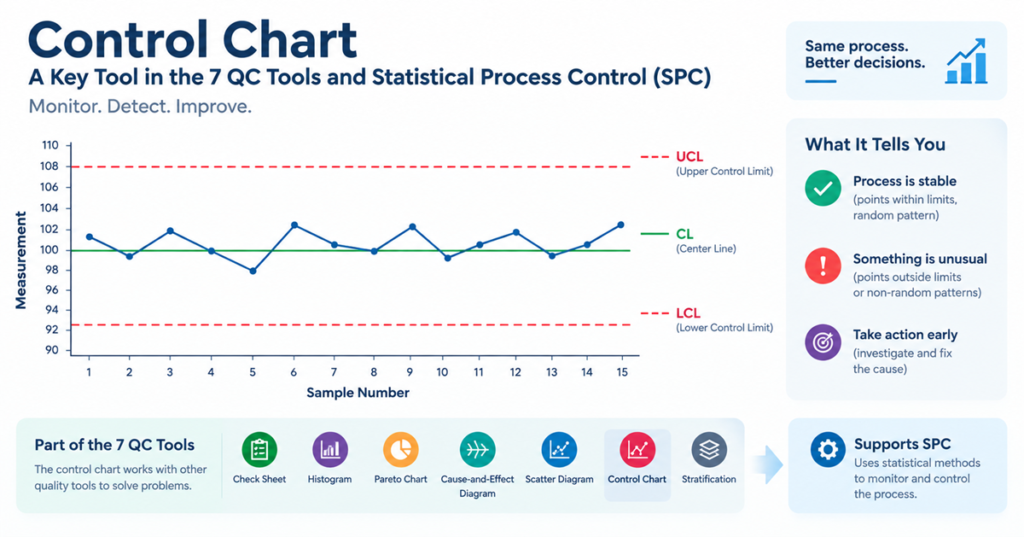
Control Charts – 7 QC Tools | Types, Benefits & Examples
Control Charts are one of the 7 QC Tools and an important part of SPC, it helps quality teams distinguish normal process variation from unusual signals and take appropriate action.
In this guide, you’ll learn everything about Control Charts, what it is, why it is use, and how to use to find out variation in process.
Table of Contents
ToggleWhat is Control Chart ? SPC Chart | Shewhart Chart
A Control Chart is a statistical tool that is used to monitor and control process stability or process behavior, and improve process performance over time.
It is also known as Shewhart Chart or Process Behavior Chart or SPC chart.
A Control Chart is very important part of SPC (Statistical Process Control) tool.
It helps to find and control the source of Variations present in the running process.
With the help of Control chart, Process Capability of the production process is measured by Cp and Cpk and Pp and Ppk study.
This is very important basic 7QC Tools and extensively used in SPC and Problem Solving Techniques such as 8D, PDCA and Six Sigma.
Types of Control Chart
There are two types of control Charts :
1- Variables (Continues Value)
X -R chart (Average value and range)
X (MR) chart (measured value)
2- Attributes (Discrete Value)
- pn chart (Number of defective value)
- p chart (Fraction Defectives)
- c chart (Number of Defects)
- u chart (Number of defects per unit)
Elements of Control Charts
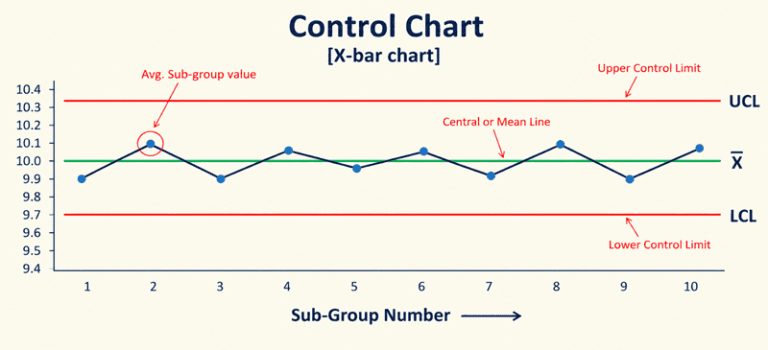
- Horizontal axis for sample number or sub-group value.
- Vertical axis for sample statistics e.g. Target or Avg. mean line, UCL and LCL Line.
- Target or Avg. Mean or Central Line – X bar
- Upper control Limit line-UCL Line
- Lower control Limit line-LCL Liner
- Plotting of the sample sub-group avg. value.
Benefits of Control Charts
To predict process visually.
Helps to identify Common and Special cause of variations.
Provides indication for taking action.
Steps for making Control Chart
Fulfill precondition
Complete preparatory steps
Data/Information collection
Making Trial Control limits
Validation of trial control limits.
Process Capability study i.e Cp and Cpk study
Ongoing process control
Continual improvement
Calculation of Trial Control Limits
- Trial Control limits for Average Chart:
UCLx = X double bar + A2*R bar
LCLx = X double bar – A2*R bar
Trial Control limits for Range Chart:
UCLR = D4 * R bar
LCLR = D3 * R bar
Where D4, D3 and A2 are constant varying as per sample sub-group size.
Also checkout other quality related article:
- Production Part Approval Process (PPAP)
- Statistical Process Control (SPC)
- Measurement System Analysis (MSA)